Computer Studies - Junior Secondary 3 - Graphs
Graphs
Graphs
Term: 2nd Term
Week: 10
Class: Junior Secondary School 3
Age: 14 years
Duration: 40 minutes of 2 periods each
Date:
Subject: Computer studies
Topic:- Graphs
SPECIFIC OBJECTIVES: At the end of the lesson, pupils should be able to
INSTRUCTIONAL TECHNIQUES: Identification, explanation, questions and answers, demonstration, videos from source
INSTRUCTIONAL MATERIALS: Videos, loud speaker, textbook, pictures
INSTRUCTIONAL PROCEDURES
PERIOD 1-2
|
PRESENTATION |
TEACHER’S ACTIVITY |
STUDENT’S ACTIVITY |
|
STEP 1 INTRODUCTION |
The teacher revises the previous lesson on database |
Students pay attention |
|
STEP 2 EXPLANATION |
She defines a graph and states its uses |
Students pay attention and participates |
|
STEP 3 DEMONSTRATION |
She mentions and explains the types of graphs
|
Students pay attention and participate |
|
STEP 4 NOTE TAKING |
The teacher writes a summarized note on the board |
The students copy the note in their books |
NOTE
GRAPHS
A graph is a diagram showing the relationship between varying quantities. It is also a diagram used to indicate the relationship between two or more variable quantities.
USES OF GRAPHS
Graphs are used for the following purposes;
TYPES OF GRAPHS AND THEIR USES
There are different types of charts (graphs) available in spreadsheet programs such as Microsoft Excel, Lotus1,2,3, Sage, and Peachtree. Common charts available and their uses include the following:
1. Column

This chart compares values across columns.
Sub-types include;
2. Bar chart

Sub-types include:
3. Line graph

This graph displays trends over time or series.
Sub-types include:
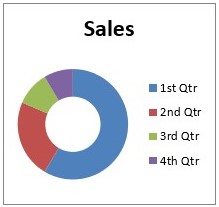
4. Pie Chart

This chart displays the contribution of each value to a total. Pie chart types include the following;
Other types of charts are; Scatter chart,

Area chart,

Doughnut chart,
Radar chart

etc.
EVALUATION: 1. Define Graphs
CLASSWORK: As in evaluation
CONCLUSION: The teacher commends the students positively