Lesson Notes By Weeks and Term - Senior Secondary School 1
CONCEPT OF SUPPLY
SUBJECT: ECONOMICS
CLASS: SS1
DATE:
TERM: 3RD TERM
REFERENCE BOOK
WEEK SIX
CONCEPT OF SUPPLY
CONTENT
DEFINITON OF SUPPLY
Supply may be defined as the quantity of goods and services which sellers are willing and able to offer for sale at a particular price, and at a particular period of time. Supply does not mean the entire stock of a commodity in existence or the total quantity of that commodity produced but rather it means only the amount that is put into the market or offered for sale at a given price and at a particular period of time. This is referred to as ‘Effective Supply’
LAW OF SUPPLY
The law of supply states that, all things being equal, ‘The higher the price, the higher the quantity of a commodity that will be supplied or the lower the price, the lower the quantity of the commodity that will be supplied’. This law is often regarded as the second law of demand and supply. This law explains that when the price of commodity is high in the market, more quantity of that commodity will be supplied by the producer, and vice-versa.
EVALUATION
SUPPLY SCHEDULE
Supply schedule is a table of value showing the relationship between the price and the quantity of that commodity supplied. It is the table showing the relationship between the quantity supplied and price of a commodity. Supply schedule is divided into two which are:
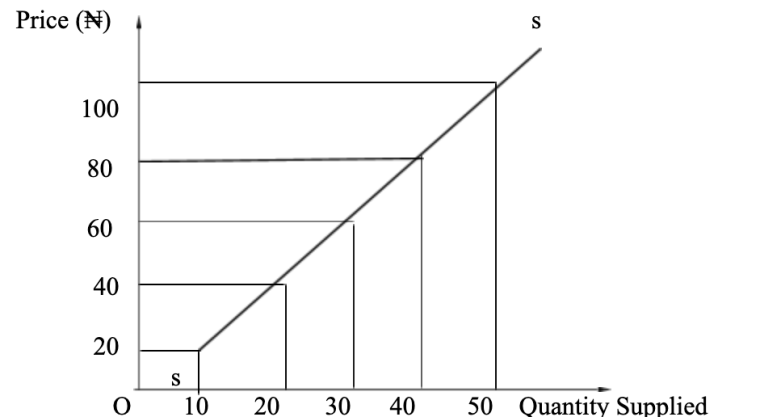
The table below shows the individual supply schedule for bags of wheat.
Price per bag (â¦) | Quantity supplied (No. of bag of wheat) |
100 | 50 |
80 | 40 |
60 | 30 |
40 | 20 |
20 | 10 |
The table below shows the market supply schedule for bags of wheat
Price Individual Suppliers Total
per bag | Quantity Supplied by | Quantity supplied by | Quantity supplied by | Quantity/Market |
(â¦) | Mr. Segun | Mrs. Jolaoso | Mr. Ade | Supplied |
100 | 50 | 80 | 70 | 200 |
80 | 40 | 70 | 50 | 160 |
60 | 30 | 60 | 30 | 120 |
40 | 20 | 50 | 20 | 90 |
20 | 10 | 40 | 10 | 60 |
SUPPLY CURVE
Supply curve is the graphical representation of the supply schedule. It shows the relationship between the price and quantity of that commodity supplied by the producer. Supply curve is derived from a supply schedule.

Unlike the demand curve, the supply curve slopes upward from left to right. Both the supply curve and the supply schedule illustrate the law of supply, which states “the higher the price of a commodity, the higher the quantity supplied and vice versa.
TYPES OF SUPPLY
COMPLEMENTARY (JOINT) SUPPLY: This supply occurs when two or more commodities are produced and supplied from one source. An increase in the production and supply of one will automatically bring about increase in the production and supply of the other commodities that are produced from the same source, eg an increase in production and supply of petrol from petroleum (crude oil) can lead also to an increase in supply of kerosene and other products from crude oil.
COMPETITVE (SUBSTITUTE) SUPPLY: This supply occurs when many commodities are supplied for the satisfaction of a particular want. In other words, it is the supply of two or more commodities that serves as substitute or alternative to one another, eg meat and fish, omo blue detergent and elephant blue detergent, margarine and butter.
COMPOSITE SUPPLY: This supply occurs when a certain commodity can serve two or more purposes. In other words, the supply of the commodity for one purpose will greatly affect the supply of the same commodity for another purpose, eg flour for production of doughnut will greatly affect the production of cake, cassava for the production of starch will greatly affect the production of garri.
EVALUATION
FACTORS INFLUENCING THE SUPPLY OF A COMMODITY
EXCEPTION TO THE LAW OF SUPPL
Exceptional or Abnormal Supply: is the supply pattern which does not abide by the law of supply, and
therefore, gives rise to the reverse of the basic law of supply which states that the higher the price, the higher the quantity of commodity that will be supplied by the producer, and vice-versa. An abnormal supply also called a Regressive or Backward Sloping Supply Curve. Shows that at higher price, less quantity will be supplied. That is a negative situation in which a fall in the price of a commodity leads to an expansion of its supply
Abnormal supply curve (Labour)

Causes of abnormal supply are as itemized below:
EVALUATION
READING ASSIGNMENT
Amplified and simplified Economics for SSS by Femi Longe Page 267-273
Fundamentals of Economics by Anyawuocha Page 222-226.
GENERAL EVALUATION QUESTIONS
WEEKEND ASSIGNEMENT
THEORY
© Lesson Notes All Rights Reserved 2023