Lesson Notes By Weeks and Term - Primary 2
Data collection
Data collection
WEEK 9&10
Subject: Mathematics
Term: 3rd Term
Class: Primary 2
Topic: Data collection
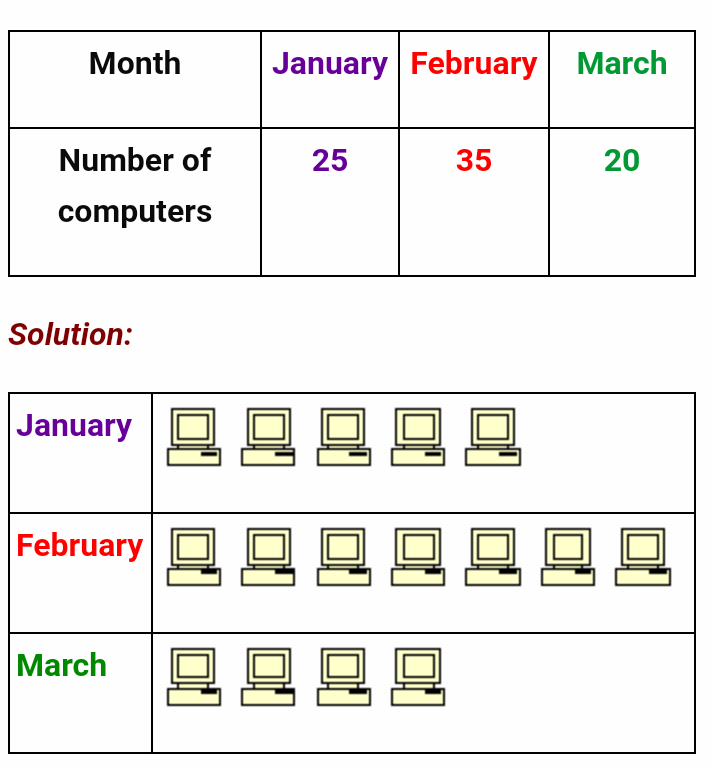
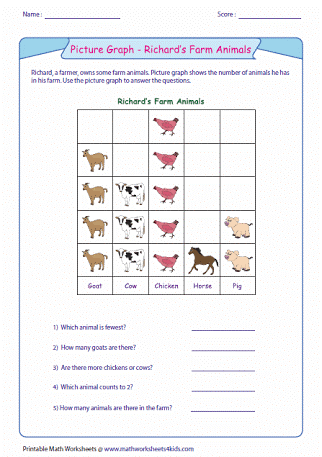
A pictogram or pictograph represents the frequency of data as pictures or symbols. Each picture or symbol may represent one or more units of the data.
Example:
The following table shows the number of computers sold by a company for the months January to March. Construct a pictograph for the table.
Example:
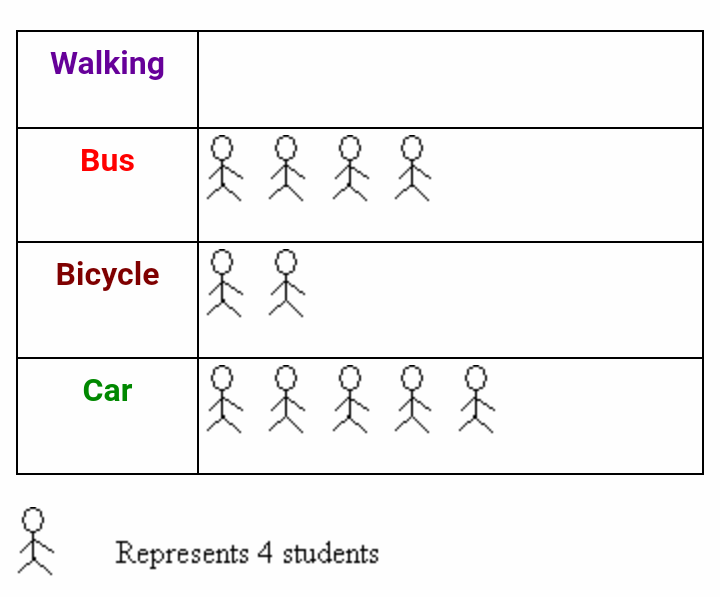
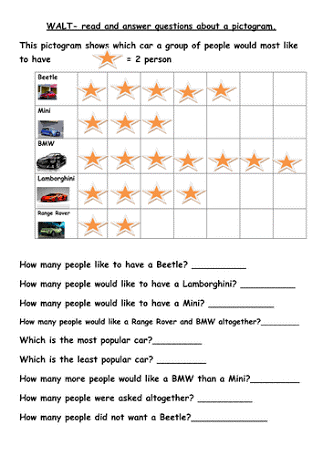
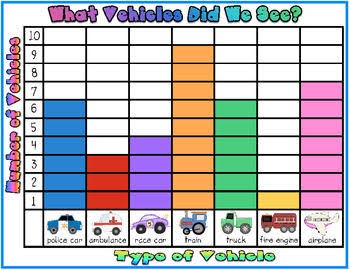
The following pictograph shows the number of students using the various types of transport to go to school.
.
Solution:
There are already 11 symbols on the table. So, the number of symbols to be added for ‘Walking’ is 14 – 11 = 3
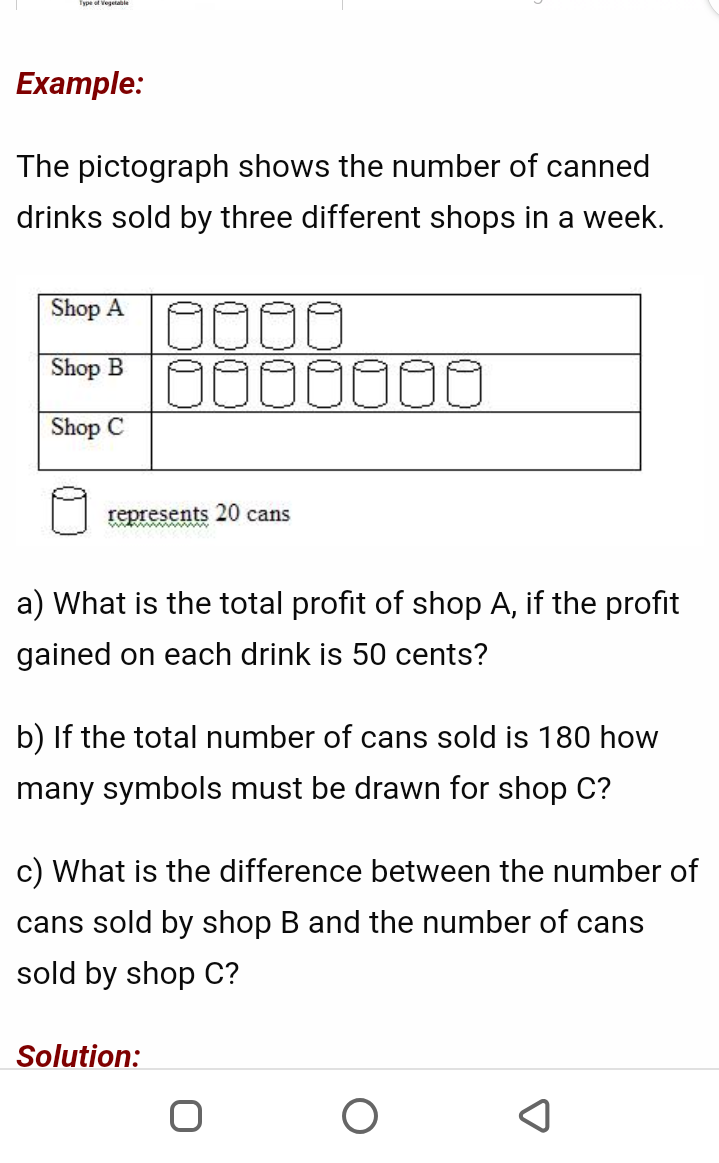
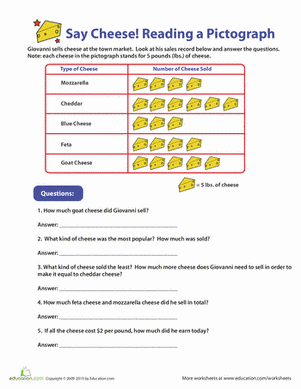
a) Total profit of shop A= 20 × 4 × 0.5 = $40
b) 9 symbols must be drawn for shop C. (9 x 20 = 180)
c) Difference between shop B and shop C = 20 × 2 = 40 cans
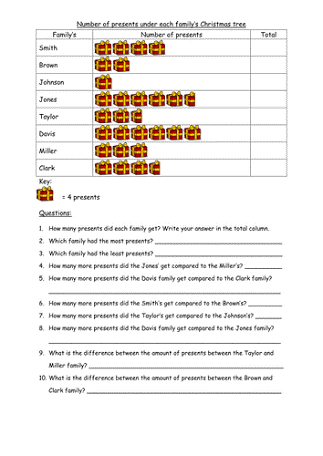
Exercise
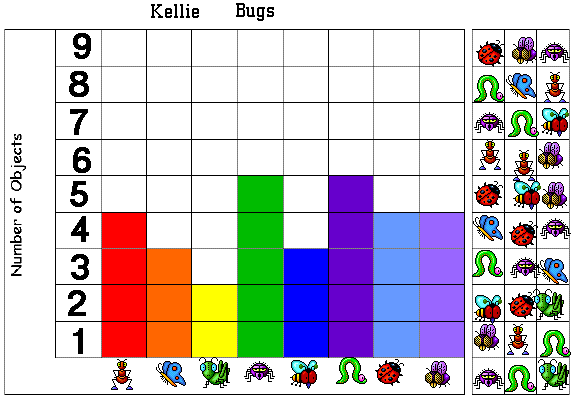
BLOCK CHART
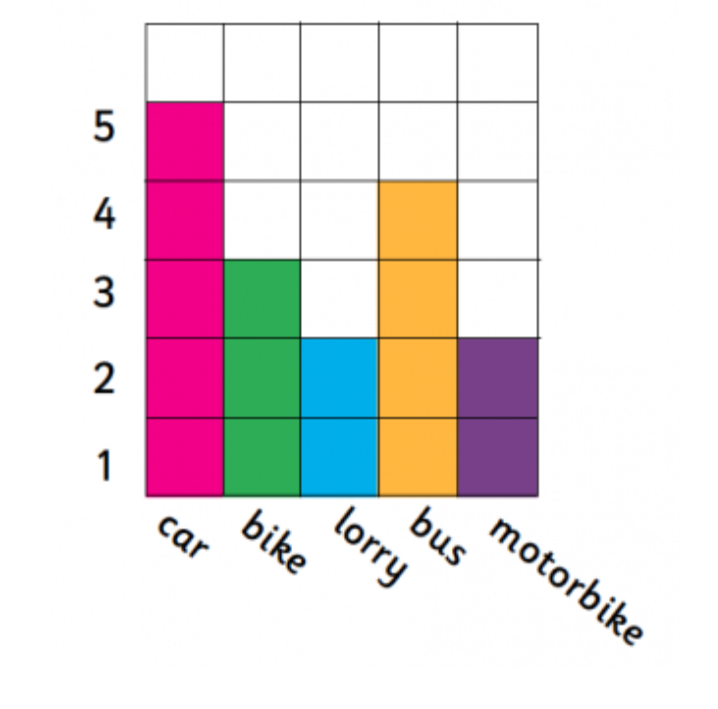
Which vehicle did you see the most?
Which vehicle did you see the least?
How many more cars than lorries did you see?
How many vehicles did you see altogether
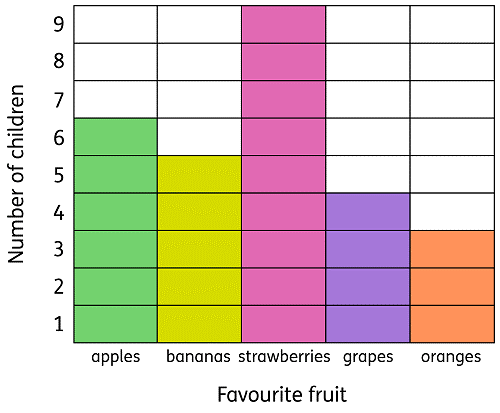
Exercise
© Lesson Notes All Rights Reserved 2023